Identify Fraud from Enron Emails using Machine Learning
Summarize for us the goal of this project and how machine learning is useful in trying to accomplish it. As part of your answer, give some background on the dataset and how it can be used to answer the project question. Were there any outliers in the data when you got it, and how did you handle those?
In 2000, Enron was one of the largest companies in the United States. By 2002, it had collapsed into bankruptcy due to widespread corporate fraud. Many executives at Enron were indicted for a variety of charges and some were later sentenced to prison. In the resulting Federal investigation, a significant amount of typically confidential information entered into the public record, including tens of thousands of emails and detailed financial data for top executives. The Enron Corpus is a large database of over 600,000 emails generated by 158 employees of the Enron Corporation and acquired by the Federal Energy Regulatory Commission during its investigation after the company's collapse.
The goal of this project is to identify persons of interest (POI) using machine learning in the Enron fraud case using the data from the Enron corpus. Machine Learning will help us build a predictive model to find patterns which in turn will help identify POIs. We will basically build a classifier from training data and use it to make predictions on the testing data.
The dataset contains 146 data points out of which 18 are POIs and the rest i.e. 128 are non-POIs. There are 21 features in this dataset which are of three types, namely, financial features, email features and POI labels.
financial features: ['salary', 'deferral_payments', 'total_payments', 'loan_advances', 'bonus', 'restricted_stock_deferred', 'deferred_income', 'total_stock_value', 'expenses', 'exercised_stock_options', 'other', 'long_term_incentive', 'restricted_stock', 'director_fees'] (all units are in US dollars)
email features: ['to_messages', 'email_address', 'from_poi_to_this_person', 'from_messages', 'from_this_person_to_poi', 'shared_receipt_with_poi'] (units are generally number of emails messages; notable exception is ‘email_address’, which is a text string)
POI label: [‘poi’] (boolean, represented as integer)
Outliers
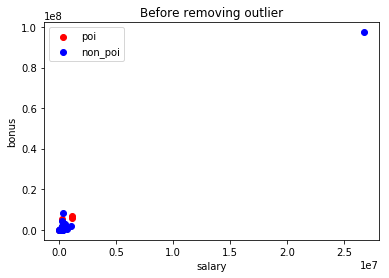 | 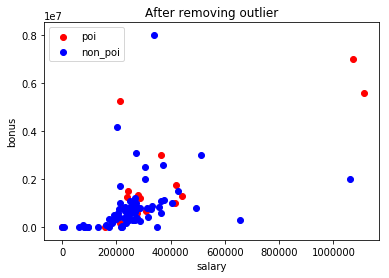 |
Plotting the scatterplot above, makes it easy to spot the outliers. The TOTAL which was probably generated as a spreadsheet function, is a large outlier in the financial features. So I removed it. Based on the FindLaw's Payments to Insiders report, I also removed the THE TRAVEL AGENCY IN THE PARK entry which doesn't belong to any employee.
Missing values
Except the POI feature (which has been added later), all other features in the original data have missing values.
{
"salary": 50,
"to_messages": 58,
"deferral_payments": 106,
"total_payments": 21,
"exercised_stock_options": 43,
"bonus": 63,
"restricted_stock": 35,
"restricted_stock_deferred": 127,
"total_stock_value": 19,
"director_fees": 128,
"from_poi_to_this_person": 58,
"loan_advances": 141,
"from_messages": 58,
"other": 53,
"expenses": 50,
"from_this_person_to_poi": 58,
"deferred_income": 96,
"shared_receipt_with_poi": 58,
"email_address": 33,
"long_term_incentive": 79
}
I did not handle the missing values separately, as the feature_format.py file provided, treats NaN as 0 while preprocessing.
What features did you end up using in your POI identifier, and what selection process did you use to pick them? Did you have to do any scaling? Why or why not? As part of the assignment, you should attempt to engineer your own feature that does not come ready-made in the dataset -- explain what feature you tried to make, and the rationale behind it.
New features
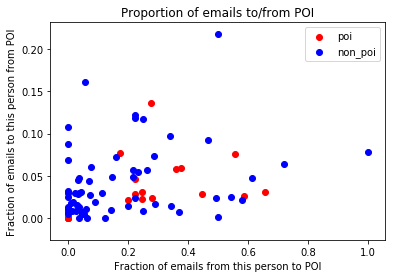
The dataset already contained two features from_this_person_to_poi and from_poi_to_this_person. These give the number of emails sent or received. Now there may be someone with a small number of from_poi_to_this_person value. And we may think he doesn't receive enough email from POI. But it's possible he may in general be receiving less email too. And it may turn out that all or most of those emails were from a POI.
Hence using the from_this_person_to_poi and total to_messages, I calculated the ratio fraction_to_messages which indicates how frequently the person writes to POIs. Similarly I have calculated the fraction_from_poi ratio using from_poi_to_this_person and from_messages which indicates the fraction of emails received by a person from POIs. These could be useful features in finding POIs. Below is a scatterplot of the fraction_to_poi and fraction_from_poi features.
Feature Scaling
Feature scaling was performed using MinMaxScalar. This estimator transforms each feature individually such that it's in a given range namely 0 and 1. For tree based algorithms like Decision Tree feature scaling is not required. But it was necessary for distance based algorithms like SVM. For consistency, I have applied MinMaxScalar to the feature set and then used it for all classifiers.
Feature selection
Feature selection was performed using SelectKBest module. I gave all the features in the feature set (except email_address) as an input to the module. I removed email_address because it's a string that identifies the person and wouldn't play a role in identifying POI. Feature scaling was first applied before applying them to an algorithm. For each algorithm used, the SelectKBest method came up with a different number of features. Here is a summary of the findings for the four algorithms namely Gaussian Naive Bayes, Support Vector Machines, Random Forest and Decision Tree which I tried.
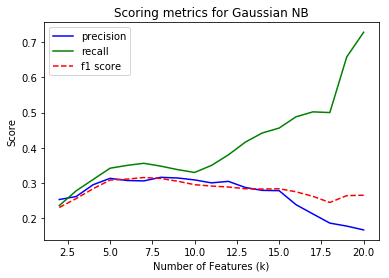
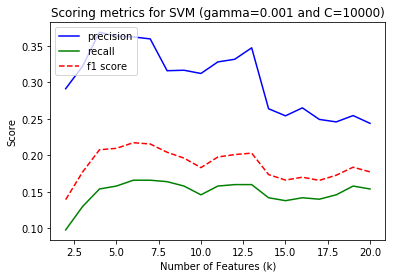
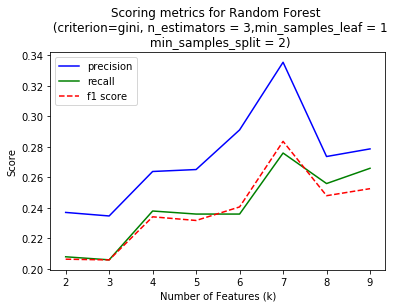
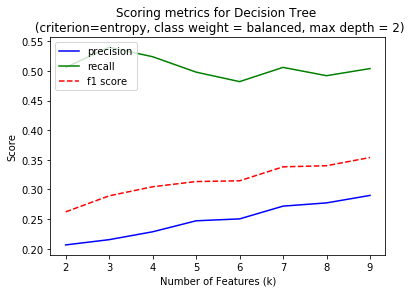
I am looking to optimize the performance using f1 score which considers both precision and recall. Some algorithms gave better performance with high number of features. But I chose to limit number of feaures to < 10 to reduce the chances of overfitting and also the time required to train the classifier. Also, classifiers like SVM, Random Forest and Decision Trees have multiple parameters to be tuned with each value of k. But the plots above are only for a single best parameter set which was considered best performing through the later part of the analysis.
Of all the algorithms I tried (details to follow), the Decision Tree Classifer performed best with nine features, which I chose as my final algorithm. The following were the list of features along with their feature scores from SelectKBest and their feature importances from the Decision Tree Classifier.
| Feature | Feature Score (from SelectKBest) | Feature importances from Classifier |
|---|---|---|
| exercised_stock_options | 24.81507973 | 0 |
| total_stock_value | 24.18289868 | 0.22558284 |
| bonus | 20.79225205 | 0 | salary | 18.28968404 | 0.15816864 |
| fraction_to_poi | 16.40971255 | 0.61624852 |
| deferred_income | 11.45847658 | 0 |
| long_term_incentive | 9.92218601 | 0 |
| restricted_stock | 9.21281062 | 0 |
| total_payments | 8.77277773 | 0 |
The salary, total_stock_value and fraction_to_poi were the most important features as found from the classifier. The SelectKBest method also provided nine features out of which total_stock_value, exercised_stock_options and salary were the three most important features. The new feature fraction_to_poi which I had created also made it to the final selected features list.
What algorithm did you end up using? What other one(s) did you try? How did model performance differ between algorithms?
I ended up using the Decision Tree Classifier. But to decide on that, I tried a variety of classifiers first. I wanted to select algorithms where the methods used to train the classifier used techniques different from each other. And so I chose Gaussian Naive Bayes, which is based on a normal distribution, SVM which is distance based, Decision Tree which is a tree based algorithm and Random Forest which is an ensemble method for tree based classifiers.
The table describes the best performance of each and the number of features and parameters for obtaining those.
| Algorithm | Number of features (SelectKBest) |
Parameter values | Precision | Recall | F1 Score | Accuracy |
|---|---|---|---|---|---|---|
| Gaussian Naive Bayes | 7 | - | 0.37 | 0.32 | 0.34 | 0.84 |
| Random Forest | 7 | criterion='gini', n_estimators=3, min_samples_split = 2, min_samples_leaf = 1 |
0.37 | 0.27 | 0.31 | 0.84 |
| SVM | 6 | kernel='rbf', gamma='0.001' C=10000 |
0.36 | 0.09 | 0.14 | 0.85 |
| Decision Tree | 9 | criterion='gini', max_depth=2 class_weight='balanced' |
0.36 | 0.59 | 0.44 | 0.80 |
As mentioned earlier, the best F1 score gives the greatest possibility of good performance in this particular case. And I needed a balance between precision and recall, not compromising on one at the cost of other. So I ended up using the Decision Tree Classifier. Other algorithms did not give a good recall rate.
Note: Aside from the table above, I would also like to mention that I tried using the Decision Tree with > 10 parameters to see how it works. With 16 features, it gave a precision = 0.43 and recall=0.65. Apart from the possibility of overfitting, it also didn't seem to improve the precision or recall drastically. Hence I decided to keep the Decision Tree Classifier with 9 features from the table above.
What does it mean to tune the parameters of an algorithm, and what can happen if you don’t do this well? How did you tune the parameters of your particular algorithm? What parameters did you tune?
Parameter tuning is necessary to enable the algorithm to perform best. If not done well it can result in overfitting or occassionally underfitting too. Except GaussianNB, which didn't offer any parameters to tune, I tuned paramteres for other algorithms using GridSearchCV. Since a large number of parameters needed to be tuned, GridSearchCV made it easy to consider all combinations of parameters and gave the best possible result.
For the Decision Tree classfier, I used criterion as gini or entropy, max_depth as 1,2,3,4 and class weight as None or balanced. If no parameters are specified to a decision tree and the default model is used, it would very likely lead to a very large tree on some datasets which will be complex and consume memory too.
GridSearchCV finally chose criterion = 'gini', max_depth = 2 and class_weight = 'balanced' for the best performance which gave precision value of 0.36 and recall of 0.59.
What is validation, and what’s a classic mistake you can make if you do it wrong? How did you validate your analysis?
Cross validation is a technique used to check the performance of the training algorithm, by dividing the dataset into a training set and a testing set. The goal is to create an algorithm such that it learns from the training set and makes predictions well on the testing set. A classic mistake is to test the algorithm on the same set that it was trained on. This will give suspiciously great results, which often point to this mistake.
I used the Stratified Shuffle Split cross validation method to validate my algorithm's performance. Because the Enron dataset is so small, it's possible that the training set may not represent the whole data and may end up causing overfitting. Stratified Shuffle Split uses a parameter called folds, which splits the whole data into multiple sets to get more accurate results. The parameters specified have been such that, the dataset is divided using a test size = 0.3 which means it randomly splits 70% of the 146 data points into training and 30% for testing. And it takes the average of 100 such events.
Give at least 2 evaluation metrics and your average performance for each of them. Explain an interpretation of your metrics that says something human-understandable about your algorithm’s performance.
I used the precision and recall evaluation metrics to gauge the performance of my algorithms. What recall measures is, that out of all the elements that are indeed positive, how many were classified as positive i.e. classfied positive correctly.
Precision is the ability of the algorithm to find out of all the elements predicted as positive, how many are truly postive.
Mathematically,
Recall = True Positive/ (True positive + False negative)
Precision = True positive/ (True positive + False positive)
The algorithm that I chose has precision = 0.36 and recall = 0.59.
So what this means is that when the DecisionTree classifier I have selected observes that someone is a POI, the probability that he's indeed a POI is 0.36. And provided the person is POI, the probability that our classifier can correctly identify him is 0.59.
For this dataset, I am assuming that the results from the classifier are used as a guiding first step to catch POIs and are not a replacement for a court/jury. Given that, it would be important not to miss any POIs. And it's okay if some non-POIs are classified as POIs. So a better recall rate is preferred. It's nice to have a good precision rate, i.e. I am labeling POIs correctly, when they are actually POIs. But I don't want it at the cost of recall. So another reason I chose the Decision Tree Classifier was that even though all classifiers have roughly similar precision rate, Decision Tree has the best recall rate.
Conclusion
Machine learning techniques were used to identify Persons of Interest (POI) from the Enron dataset. Financial and email data was available and combined into a single dataset for further processing. New features like fraction_to_poi and fraction_from_poi were added and the existing features were scaled using MinMaxScalar. Feature selection was done using SelectKBest algorithm. Parameter tuning was performed using GridSearchCV for four algorithms namely Gaussian Naive Bayes, SVM, Random Forest and Decision Trees. The Decision Tree Classifier gave the best performance with precision=0.36 and recall=0.59.
The most challenging aspect of this dataset was the small size. With only 146 data points, there were limitations on splitting the dataset into training and testing sets, and risk of overfitting.
Going forward, the parameters of the algorithms can be tuned further for better performance. Even for the Decision Tree classifier that I eventually chose, not every parameter was tuned and doing that would possibly improve the precision and recall even further. Other algorithms could also be explored to see if there's a possibility of achieving even better performance.